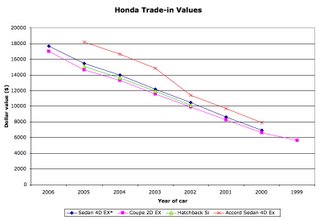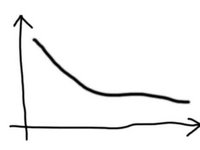
Here's the results of my research. It's not too encouraging. The motivation is to lower my monthly payments. The idea was based on the two word-of-mouth assumptions, that cars lose a big part of their value the moment they're driven off the lot, and that Honda's don't deprecate quickly after that. Don't pay too much attention to the exact values, they're taken from the NAPA book, rather than Kelly's Blue Book, because that's what the library has. Of note is that the trend is similar for all the models considered. The point is that the trend is linear over the first five or so years, rather than the sharp initial drop and soft flattening out the two assumptions would lead you to suspect. Something like figure 2.

The motivation was that i could sell sabado in, say, three years, recover roughly the cost of the loan on it, and buy a cheaper honda (a prelude, say, or a model without a navigation system), thus reducing my monthly payments. In the big book of caleb's budget, car payments are the second-largest monthly expense (rent is the undisputed winner). This is a class of analysis (if you have a name for it, please volunteer), based on the idea that, of several factors, two or three will be by far the largest contributors. So, in this case, my Netflix subscription is just shy of 1% of my monthly expenses, whereas my rent is a solid 31%. Lots of other things can be looked at in this manner (process time of elements of a piece of software, say, or cooking times of parts of thanksgiving dinner).
I guess i'll be driving sabado for the next five years, at least. Mind you, i love the car. But optimization is my speshee-alitee. This is the life of the engineer.
3 comments:
Consider the total number of miles that a car will get before incurring any costs for non-routine maintenance. That is, how many miles will the car drive, while you pay for oil changes every 3,000 miles; a timing belt, head gasket and starter motor at 120,000 miles; new shocks, half-axles, cv boots every 60,000 or so? While you pay for this routine maintenance, before incurring any costs for major repairs or rebuilds, call these miles M.
(Some people would argue that a timing belt is a major repair. A Japanese car owner should rightfully view it as routine maintenance. Japanese cars actually have a major set of scheduled maintanence at 120,000 miles that ushers in the car's second life, its mature life.)
Consider your total purchase price for the car, whether bought outright or financed--if financed, include interest--and call this value P.
I measure the value (V) of a car as M/P.
V = M/P
If you do all the scheduled maintenance, you can expect a Honda or a Toyota to get 250,000 miles on routine maintenance, so calculate M by subtracting the odometer reading (O) from 250,000.
M(Japanese)= 250,000 - O
For an American automobile, you can expect to get about 125,000, so,
M(American car) = 125,000 - O
(Pick-up trucks tend to get higher mileage than their automobile siblings)
My formula for value should give you a measure of value that is very sensible--the number of miles you will get for each dollar you spend--and can be used to compare cars of different ages and nationalities.
I have never actually done the following, but I believe there is a "value sweet spot" among Japanese cars that are about 9 to ten years old. That is, I think V is maximized for '95 Accords, Corrollas, Civics, and Camrys.
On that logic, I would suggest you consider selling your current car to the highest bidder, and buying a '95-'97 Accord. (the ten-year-old Accords are about the same size as the modern Civics.)
Oh, in my previous comment, in the first paragraph, M is not the total number of miles. It is the number of miles the car will still get, starting now.
I think the two pieces i'm missing are the initial price, which might spike the front of the graph, and the prices for the next five years (out to the ten-year mark that zack is talking about). Those later five years might be where the graph levels off. These two pieces would then give more of the shape in figure 2. This warrants another trip to the library.
Post a Comment